· Jack Young · Education · 3 min read
Unit 3 (P7, M2): Management Information System
Use IT tools to produce management information and generate valid, accurate and useful information.

Use IT tools to produce management information (P7)
Generate valid, accurate and useful information (M2)
I have produced a management information system for the Stationery Shop for The Nobel School.
Supplier
The first thing I did to make the management information system is to collect information about the supplier. This tells us where we order the products and how much it cost and how many you get in a pack when you order. I also divided the total amount by the quantity you get in a pack, so it tells me the price per individual. Since schools cannot make profit from this shop, which means that they must sell the products at the same price as they purchased it or less. In this case, the price per individual product is going to be the selling price (a pen will cost 19 pence).
| Product Name | Quantity | Price | Total |
|---|---|---|---|
| Pen | 100 | £0.19 | £19.38 |
| Pencil | 36 | £0.26 | £9.25 |
| Rubber | 6 | £0.28 | £1.65 |
| Sharpener | 5 | £0.38 | £1.88 |
| Ruler | 1 | £1.08 | £1.08 |
| Calculator | 1 | £15.53 | £14.53 |
| Protractor | 1 | £0.87 | £0.87 |
| Compass | 10 | £0.99 | £9.91 |
| Headphones | 1 | £8.28 | £8.28 |
| Total | £66.83 |
Sales
This is then transferred into another tab in the spreadsheet document which has all the information about sales and stock levels over the course of the year. The picture below shows the sales that have been made monthly. It also shows the total amount sold for each product for each month and for the whole year.
| Product Name | January | Februrary | March | April | May | June | July | August | September | October | November | December | Total | |
|---|---|---|---|---|---|---|---|---|---|---|---|---|---|---|
| Pen | 14 | 25 | 123 | 87 | 254 | 214 | 76 | 67 | 59 | 68 | 74 | 33 | 1094 | |
| Pencil | 17 | 27 | 36 | 34 | 152 | 255 | 80 | 60 | 67 | 44 | 38 | 31 | 841 | |
| Rubber | 9 | 10 | 8 | 16 | 92 | 153 | 22 | 17 | 24 | 27 | 25 | 21 | 424 | |
| Sharpener | 4 | 6 | 5 | 27 | 48 | 167 | 31 | 29 | 28 | 37 | 36 | 32 | 450 | |
| Ruler | 7 | 8 | 4 | 12 | 148 | 159 | 34 | 28 | 43 | 38 | 32 | 27 | 540 | |
| Calculator | 2 | 4 | 5 | 16 | 71 | 236 | 22 | 25 | 23 | 23 | 19 | 16 | 462 | |
| Protractor | 1 | 6 | 3 | 36 | 89 | 190 | 27 | 13 | 19 | 21 | 6 | 4 | 415 | |
| Compass | 1 | 4 | 8 | 12 | 78 | 210 | 34 | 15 | 13 | 17 | 8 | 2 | 402 | |
| Headphones | 0 | 2 | 2 | 23 | 43 | 90 | 33 | 18 | 3 | 3 | 2 | 4 | 223 | |
| Total | 55 | 92 | 194 | 263 | 975 | 1674 | 359 | 272 | 279 | 278 | 240 | 170 | 4851 |
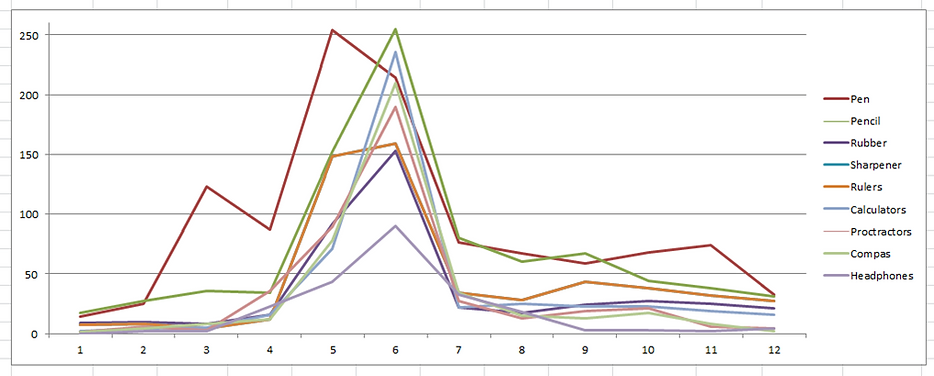
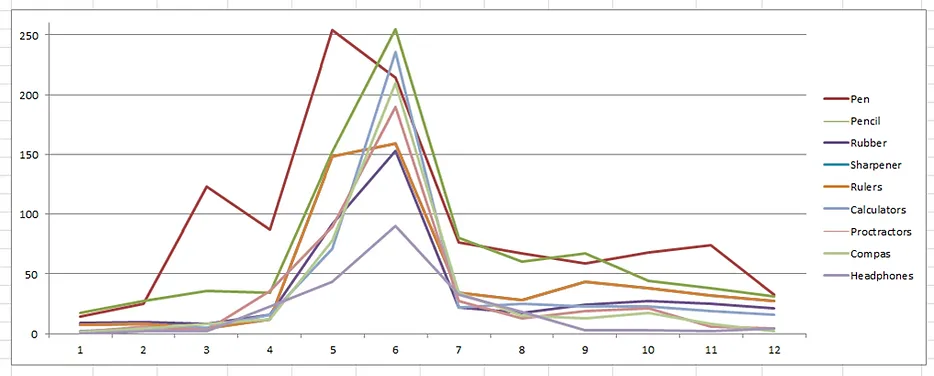
The Sales throughout the year is then collected and shown as a line graph to easily identify and compare what is selling the most at what points in the year. This is important to The Nobel School as they cannot make a profit to a student which means they can focus more on what sells the most instead of what makes the most money. This graph represents what The Nobel School needs.

Stock
The picture below shows the information about the stocks levels throughout the year. Initially, the school has ordered 500 stock for pens, pencils etc. at the start of the year to see how well each one sells to determine how much they need in a couple of months’ time when the next order batch occurs. The purchase of stock is also reflected in the stock table. The amount of stock that was purchased is calculated and presented in the column next to the purchases of stock. The money spent is calculated by multiplying the purchase of stock with the selling price on the supplier information tab in the same spreadsheet. The total is shown of how much is spent in year 2015 for each product.
| Product Name | January | Februrary | March | April | May | June | July | August | September | October | November | December |
|---|---|---|---|---|---|---|---|---|---|---|---|---|
| Pen | 486 | 461 | 338 | 251 | 497 | 283 | 207 | 140 | 281 | 213 | 139 | 106 |
| Pencil | 483 | 456 | 420 | 386 | 434 | 179 | 99 | 39 | 172 | 128 | 90 | 59 |
| Rubber | 191 | 181 | 173 | 157 | 265 | 112 | 90 | 73 | 249 | 222 | 197 | 176 |
| Sharpener | 196 | 190 | 185 | 158 | 310 | 143 | 112 | 83 | 255 | 218 | 182 | 150 |
| Ruler | 293 | 285 | 281 | 269 | 321 | 162 | 128 | 100 | 257 | 219 | 187 | 160 |
| Calculator | 198 | 194 | 189 | 173 | 302 | 66 | 44 | 19 | 196 | 173 | 154 | 138 |
| Protractor | 199 | 193 | 190 | 154 | 265 | 75 | 48 | 35 | 216 | 195 | 189 | 185 |
| Compass | 199 | 195 | 187 | 175 | 297 | 87 | 53 | 38 | 225 | 208 | 200 | 198 |
| Headphones | 100 | 98 | 96 | 73 | 230 | 140 | 107 | 89 | 136 | 133 | 131 | 127 |
Purchases of Stock (Quantity)
| Product Name | Initial | May | September | Remaining |
|---|---|---|---|---|
| Pen | 500 | 500 | 200 | 106 |
| Pencil | 500 | 200 | 200 | 59 |
| Rubber | 200 | 200 | 200 | 176 |
| Sharpener | 200 | 200 | 200 | 150 |
| Ruler | 300 | 200 | 200 | 160 |
| Calculator | 200 | 200 | 200 | 138 |
| Protractor | 200 | 200 | 200 | 185 |
| Compass | 200 | 200 | 200 | 198 |
| Headphones | 100 | 200 | 50 | 127 |
Money Spent (£)
| Product Name | Initial | May | September | Total |
|---|---|---|---|---|
| Pen | £96.90 | £96.90 | £38.76 | £232.56 |
| Pencil | £128.47 | £51.39 | £51.39 | £231.25 |
| Rubber | £55.00 | £55.00 | £55.00 | £165.00 |
| Sharpener | £75.20 | £75.20 | £75.20 | £225.60 |
| Ruler | £324.00 | £216.00 | £216.00 | £756.00 |
| Calculator | £2,906.00 | £2,906.00 | £2,906.00 | £8,718.00 |
| Protractor | £174.00 | £174.00 | £174.00 | £522.00 |
| Compass | £198.20 | £198.20 | £198.20 | £594.60 |
| Headphones | £828.00 | £1,656.00 | £414.00 | £2,898.00 |
Revenue
The money that has been gained during the sales has been represented below in a table for each month. This has been calculated by multiplying the sales and the selling price together.
| Product Name | January | Februrary | March | April | May | June | July | August | September | October | November | December |
|---|---|---|---|---|---|---|---|---|---|---|---|---|
| Pen | 196 | 625 | 15129 | 7569 | 64516 | 45796 | 5776 | 4489 | 3481 | 4624 | 5476 | 1089 |
| Pencil | 289 | 729 | 1296 | 1156 | 23104 | 65025 | 6400 | 3600 | 4489 | 1936 | 1444 | 961 |
| Rubber | 81 | 100 | 64 | 256 | 8464 | 23409 | 484 | 289 | 576 | 729 | 625 | 441 |
| Sharpener | 16 | 36 | 25 | 729 | 2304 | 27889 | 961 | 841 | 784 | 1369 | 1296 | 1024 |
| Ruler | 49 | 64 | 16 | 144 | 21904 | 25281 | 1156 | 784 | 1849 | 1444 | 1024 | 729 |
| Calculator | 4 | 16 | 25 | 256 | 5041 | 55696 | 484 | 625 | 529 | 529 | 361 | 256 |
| Protractor | 1 | 36 | 9 | 1296 | 7921 | 36100 | 729 | 169 | 361 | 441 | 36 | 16 |
| Compass | 1 | 16 | 64 | 144 | 6084 | 44100 | 1156 | 225 | 169 | 289 | 64 | 4 |
| Headphones | 0 | 4 | 4 | 529 | 1849 | 8100 | 1089 | 324 | 9 | 9 | 4 | 16 |
Profit
The money spent in total in order to purchase the products is listed here in the total spent. The money gained/loss is calculated by adding up the total for each couple of months until it reaches the order batch. The total amount of money gained/loss is shown in bold in the bottom-right corner of the column. As this is highlighted in red, it means that the school has lost money. This is good as the school is unable to make a profit, so if this was highlighted in green, it would mean the school made a profit and someone must have sold something at a higher price than it was listed. The total amount of money gained/loss is calculated by subtracting the total money spent with the sum of the total money gained for each month.
Money Spent Total
| Initial | May | September | Total |
|---|---|---|---|
| £4,785.77 | £5,428.69 | £4,128.55 | £14,343.01 |
Money Gained/Loss
| Jan-Apr | May-Aug | Sep-Dec | Total |
|---|---|---|---|
| £48.26 | £118.41 | £45.35 | £212.02 |
| £29.29 | £140.55 | £46.45 | £216.09 |
| £11.83 | £78.10 | £26.68 | £116.60 |
| £15.79 | £103.40 | £50.01 | £169.20 |
| £33.48 | £398.52 | £151.20 | £583.20 |
| £392.31 | £5,143.62 | £1,176.93 | £6,712.86 |
| £40.02 | £277.53 | £43.50 | £361.05 |
| £24.78 | £333.97 | £39.64 | £398.38 |
| £223.56 | £1,523.52 | £99.36 | £1,846.44 |
| -£3,966.46 | £2,688.93 | -£2,449.64 | -£3,727.17 |


